
Now is the time for your law firm to focus on data. With suitable data capture, data integrity, and reporting systems, law firms can better understand past performance, why their performance is at a certain level, and how they will probably perform in the future.
Our last two articles reviewed:
- Using Data Analytics to Improve Decision Making in Your Law Firm
- Financial and Operational KPIs Your Law Firm Can Track Right Now
Modeling and Performance Management
The next level is to have the tools (models) to assess how changes implemented now will impact future performance.
With data modeling techniques (data and relationships), law firms can predict and test the outcome of implemented strategies and tactics. Aggregated data (sorts, filters, queries, calculations, and reports) and targeted data points (KPIs) serve as a foundation for data analytics.
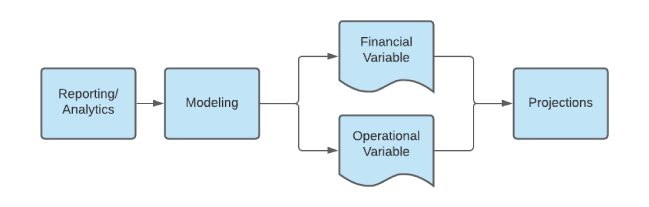
Models are created by testing different financial and operational variables to predict outcomes.
Here is a graphical representation:
Not everyone learned statistics in college, or if you are like me, took it and forgot much of it, help is available. Many of the data modeling tools have workflows that do much of the math for you. If you or a team member can identify the variables, create some assumptions, and plug numbers and ranges into a formula template, you can quickly create viable models.
It might help at this point to look at a simple example.
EXAMPLE
Assume that you are the managing partner of your law firm and need a path to improve profit margins by 5%. Your firm bills hourly for its services. The current billable timekeeper mix includes five partners, ten associates, and three paralegals. The firm’s average collected rate is $210 per hour, and the firm expects to produce 32,200 billable hours annually. The firm’s current profit margin is 30%.
Because you have sound data collection systems and data analytics disciplines, the information you need is readily available (in real life, probably not so much). You understand that working more hours and raising rates will result in more profit, but you also know the firm is already working hard, and clients will resist rate increases. You need first to identify any easy wins and then evaluate the less obvious opportunities.
Financial variables include:
- Billable hour levels
- Hourly rates
- Collected realization
- Operational expenses
- Capital reinvestment
Quantifying changes to macro (firm-level) variables is relatively easy. For example, consider the following modifications to financial variables:
- Increase rates by 5% across the board
- Assume collected realization drops to 95% from 97% due to client resistance
- Reduce overhead expenses by $50,000
Using only these factors, it is not hard to project the impact of this change:
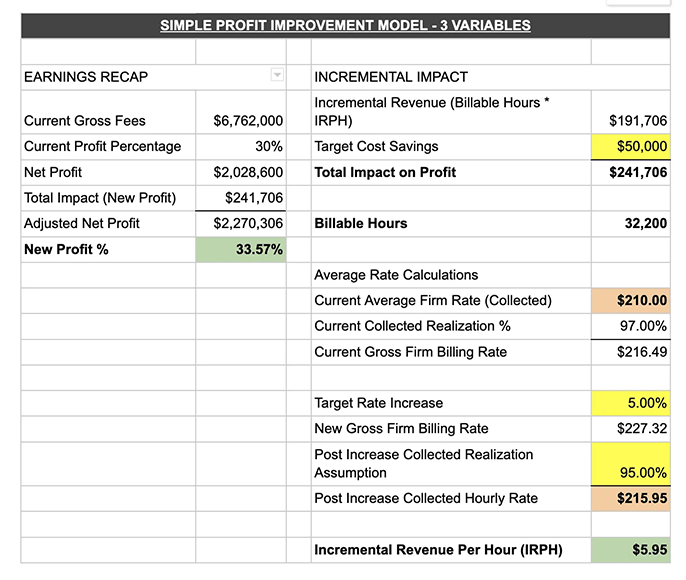
While this model is simple, it is also dynamic. You can change four variables: profit margin, target rate increase, realization decline, and cost savings.
In this example, we assumed that a rate increase of 5% would result in a 2% drop in collected realization. In this case, the 5% rate increase only results in a 3.57% increase in profit, which is short of the goal. Using this simple model, you could change other variables to identify different paths to the target profit goal.
Check the performlaw.com RESOURCES PAGE - we will soon have this template posted in an editable pdf.
Operational variables include:
- Technology
- Marketing Systems
- Work Environment
- Training and Development
- Compensation
- Workflows
- People Management
- Staffing
Operational variables are harder to quantify. An accurate estimation of the outcome of most operational adjustments relies on rich historical data sets and research. Data from within the firm is not always available. In that case, there are many law firm studies available online and from industry sources that provide helpful information. Examples of complex factors you may want to evaluate include:
- Impact of the work environment on productivity (e.g., files opened/ closed per month)
- Return on marketing systems (e.g., new client count, new business revenue)
- Effect of training plans on attorney profitability
- Impact of task automation on capacity (e.g., billable vs non-billable time by timekeeper)
To help with quantifying the impact of changes in operational variables, it is essential, for example, to measure how adjusting variables will likely impact productivity. Each variable will typically have both independent and dependent variables associated with it. Here are some examples of variables you might measure that would likely affect performance:
- Technology: practice or case management software features, user experience, systems adoption, ease of remote access, ease of software collaboration, load times
- Marketing Systems: individual marketing plans, marketing and CRM software implementations, degree of client relationship management collaboration
- Training and Development: training structure, time allocated to skill development, career advancement opportunities
- Compensation: last raise, benchmark pay comparison, bonus program, and incentives
- Workflows: Availability of written SOPs, degree of task automation, degree of collaboration
- People Management: frequency of team events, last job satisfaction assessment, work environment quality
- Staffing: Capacity, attorney/ paralegal ratio, attorney age and experience distribution
One variable may also depend on another. For example, a firm may have weak training programs but an experienced staffing mix. In this instance, improvements in training will have a limited impact. Alternatively, firms with inexperienced staff will benefit significantly from better training programs.
Models can get complex quickly, but in many instances, identifying the two or three significant variables and assessing the impact of changes on them is enough to make the exercise worthwhile.
Again, it is not easy to quantify operational variables. Still, the universally available information from external sources (research studies, industry surveys, and benchmarks) and internal testing should provide sufficient data to build a model.
For example, your law firm is considering implementing advanced case management software and wants to measure impact on productivity or client satisfaction. Your options include doing some research and building a model to assess the likely result, or you could just take the vendor's word for it. All too often, the latter is the choice.
Let’s assume your firm chose to do some research and build a model, and your chosen software will yield satisfactory returns over the status quo. In that case, you now have a data-driven solution to your challenges and have employed prescriptive data analytics.
Data-driven solutions strive to remove as much decision bias and subjectivity as possible.
Here is a graphical representation of a prescriptive analytics function.
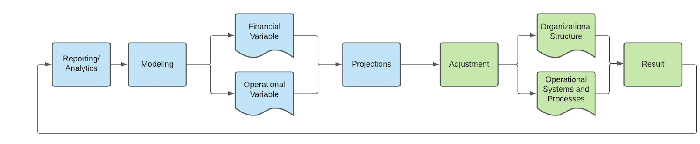
Once your management decisions incorporate the benefits of data analytics and the process becomes a habit, it gets more manageable, and synergies between your models are possible and powerful. Further, you can build targeted reports and KPIs.
It is essential to understand that KPIs (Key Performance Indicators) and advanced reporting are not effective unless the underlying data is accurate, adequately organized, and appropriately measured. If you have ever tried to use a dashboard with incorrect data, you know what we mean. It might look cool, but it is useless.
 We recommend getting professional advice before buying software that promises to provide KPIs, dashboards, and slick visualization tools.
For more information on the performance management cycle, please review our article “Performance Management for Law Firms” included in a recent issue of DRI"s "The Voice": ARTICLE LINK
