Law firms are increasingly faced with the challenge of sustaining profitability while meeting client demands for greater value. These challenging times require firms to adopt new and better ways to measure productivity and profitability. In our last post, we focused on calculating profitability per hour by timekeeper and by section. This post will extend that analysis to an individual client/ matter level.
A quality client profitability analysis will provide a firm with the needed information to make improvements that are relevant to specific clients, originators and timekeepers. Client profitability information has a number of strategic uses including:
- Pricing client work,
- Evaluating overhead,
- Evaluating staffing efficiency,
- Compensating partners,
- Adjusting ownership percentages.
Let’s see how this analysis operates in practice. If you recall our previous post, our sample firm was made up of 3 practices. The essential components of these practices are as follows:
Practice Level Detail
To view to more clear version of this image, view a full size PDF at this link .
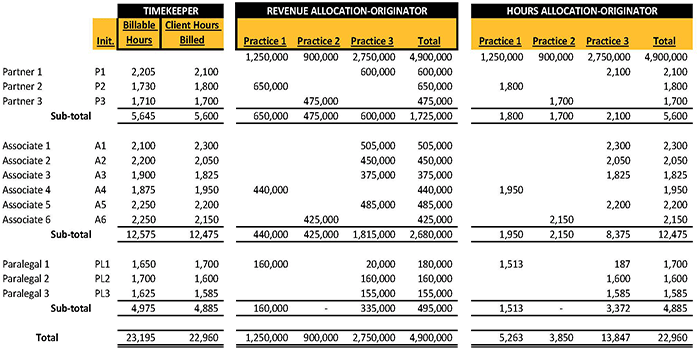
The information in this table is a starting point for creating a client profitability analysis. Timekeeper revenues and costs are allocated by client and matter, and a client and matter level analysis must ultimately reconcile with timekeeper amounts. Billable hours are used in the calculation of cost per billable hour. Client hours billed (fees relieved, billed hours etc.) are used for the application of overhead when costing client/matter work. Hours allocated by practice are important when attorneys and paralegals work in more than one practice area. In our example, only Paralegal 1 is a shared resource.
In our last post, we focused on calculating profit per hour by timekeeper and by section. Now, our focus is on analyzing profitability by client and by matter. To accomplish this analysis, we need the following data:
-
All information used to calculate average profit per hour plus
-
Updated cost information and client/matter level billing details plus
-
Accounts receivable (AR) write off information to ensure we are more closely approximating cash collections.
Recommended Timing
Completing this analysis at the billing stage is preferable because:
- Revenue, although possibly earned when worked, is most commonly regarded as made when billed;
- As hours are moved from work in progress to accounts receivable (AR), costs are more easily attached;
- A firm has more control the timing of billings than collections;
- Most firms do not have sophisticated cost accounting systems that would allow for attaching and storing costs as hours are entered into work in progress;
- For most hourly billing firms, the timing differences between working and billing are not long enough to justify the complexity of a more elaborate system;
- In most instances, assessing overhead at the collections stage requires cost information to be stored for an even longer period;
- Accounting for accounts receivable write-offs and setting reserves for older AR will approximate a cash result.
- Payroll and overhead costs are attached to all billed hours including those billed at zero (WIP write down)
Our clients often ask us about substituting collections in place of billings and leaving all cost information unchanged. While this sounds easy enough to do, it creates a probable mismatch of revenues and associated costs (collections are often the result of prior period results). For example, a client may have a matter worked in one year and paid in another. In this instance, the client will appear to have lost 100% in the billing year and show a 100% profit in the collection year.
Recall that WIP is costed when billed, and if time sits in WIP forever, no costs are applied. Care must be taken to review aging work in process periodically.
The Best Tools for the Job
We have worked with most time and billing systems and have yet to encounter one where hours and dollars billed by client/matter with timekeeper level detail are not available. A properly maintained system will contain accurate origination information. Many firms keep originations separately, which also works.
Deciding which tool to use for calculating client/matter profitability depends mostly on the amount of included data. While Excel is fine for small analyses, larger ones require a database approach.
Assuming hours and dollars detail by client/matter with timekeeper detail is available, the next step is to calculate payroll and overhead costs per hour. Please see our previous post for a detailed discussion of calculating costs per hour. The following recap indicates a summary of cost per hour by the timekeeper. As with most of our posts, you can find full-size examples on our website that are available for viewing for download. Use this link or the link below for the recap.
Fine Tuning the Analysis
If you have been following along with our posts leading up to this one, you will recall that we assumed billable hours and hours billed were the same when calculating profit per hour. Usually, this is okay as long there are not material timing differences between billable hours and hours billed. We almost always use billable hours as our divisor when calculating costs per hour. We do this to match current period costs with the current period hours worked. Again, if timing differences are not material, this does not matter as much.
Calculating Cost per Hour Detail
In the chart below, all of the various costs for each timekeeper are allocated and divided by their billable hours for the period. Note that when reviewing the report examples, all of the overhead items are grouped and reported as a single number. Many of our clients appreciate a detailed hourly breakdown of costs per hour, which is easy to do from this point.
In this example, equity partner timekeeper pay is assumed to be 35%. Some firms prefer to set an amount per hour or some amount based on the firm's compensation plan. The method used in this example assumes a market value approach to timekeeper pay. Associate and paralegal compensation is considered to be attributable to timekeeping.
In an upcoming post, we will be discussing the process for using law firm profitability data in compensation, and we will visit this topic in more detail at that time.
Cost Allocation Summary
Here is a link to a full size PDF of this chart.

Compiling Data into a Useful Format
Once the cost data is collected and allocated and the hours and billing data are in a useable format, the profitability analysis is reasonably easy to prepare.
Consider the example below for a client with two open matters.
Use this link for a full-size view.

The practice level detail provides the information for hours billed and revenue credit. The collected average rate is informational and does not factor into the analysis. The cost allocation summary is the source for the TK PR Cost/Hr. (timekeeper payroll cost per hour) and OH Cost/Hr. (overhead cost per hour). Multiplying the Cost/Hr. data by the Client Hours Billed (hours billed, billed hours, fees relieved, etc.) results in the Payroll Cost $ and Overhead Cost $.
Net Profit Before AR WO/Reserve is the net profit before considering any accounts receivable (AR) write-offs, and it the result of subtracting Payroll Cost $ and Overhead Cost $ from Revenue Credits (fees billed in most cases).
As mentioned previously, when analyzing profitability at the billed stage, it is necessary to consider amounts subsequently written off. As AR write-offs are often related to a prior period: I recommend factoring them after current year net profit is computed. Firms that regularly perform client/matter profitability analysis can review results of longer periods, providing a more accurate picture of client relationship value.
It is beneficial to view profit percentages before and after write-offs.
Interpreting Results
In my experience with clients analyzing client/matter profitability data for the first time, just having the information is interesting and informative for them. But with this new information, the conversation quickly turns to improve results.
While performing this analysis annually is certainly better than not doing it at all or doing it inaccurately, it has limited value. Performing this analysis at the end of a period (year) means it is only a look back and corrective action can only affect next year’s results.
Several of our clients now want this data on a more frequent basis. We are in the process of moving most of them to a quarterly cycle. Reviewing profitability on a quarterly basis allows for corrective action. It also recognizes that monthly swings in profitability can be dramatic based on billing cycles and workload. Having relevant data from the current year expedites corrective action, and provides relevant information for making pricing and pay decisions.
Depending on the size of the firm and the number of open matters, interpreting profitability results can be challenging. Most attorneys have a full schedule, and the last thing they want to do is read another 100 + page document.
As mentioned earlier, we prefer a database application for preparing this information. Reporting flexibility, historical data management, and query and search capabilities are useful for streamlining results analysis. Some time and billing programs have profitability modules available and may be an option.
Interpreting Our Sample Results
The report below is a simple breakout of total profitability by practice and by client, which includes results by section. Assuming the goal is to distinguish what is working from what is not, this report quickly meets this goal.
Is there a rate issue?
Actually, Practice 2’s composite rate is not the lowest of the three (column 4) and does not seem to be the issue.
Is there a cost issue?
Timekeeper pay per hour ($75.40) and overhead cost per hour ($78.06) is high and indicates a probable cost or hours issue. The cost allocation summary by timekeeper is a useful tool for identifying cost issues. Practice 2 includes Partner 3 and Associate 6. Reviewing this report indicates that partner 3 has the lowest billable hours (1,710) and second-highest total cost per hour of all the partners. Associate 6 has the lowest total cost per hour of all associates.
Given that Practice 2 is comprised of only two lawyers, Partner 3’s costs have a more pronounced effect on composite cost per hour. Connecting profitability to compensation will incent Partner 3 to grow or work more hours.
Is there a realization issue?
The client-level data by section reporting indicates that Practice 2 has one client with a significantly lower profit margin, which is related to rate or realization issue. A review of client posted rates versus billed rate will indicate the problem is related to pricing, write-offs or both.
Use this link for a full-size view.

Client 1 also has the highest timekeeper payroll and overhead when compared to the other Practice 2 clients. This may indicate an issue with specific timekeepers, which can be determined by reviewing the companion report - Client Matter Profitability/Timekeeper Sort (see the sample report two below).
Use this link for a full-size view.
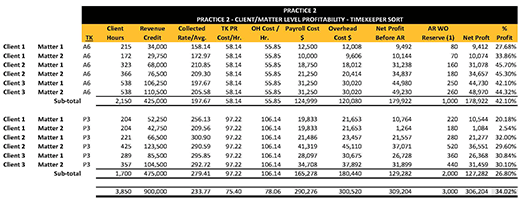
In this example, most of the issues relate to Client 1. Comparing the average rate to the posted rate for this client will indicate is the issue is related to rate or realization. Realization issues can be difficult to fix. For example, if Client 1’s work is new to the firm and there is a learning curve, improving short-term realization will be difficult. Alternatively, a firm may decide it is not suited for Client 1’s work. The analysis would continue until the primary reasons are determined.
With these analytical tools, firms can identify and address the factors causing inefficiencies before risking a client relationship by asking them to pay more when the issue is correctable.
Corrective Action
What should be done to improve results may not always be obvious. For example, poor performance related to a short-term situation with a bad file, staffing inefficiency or some other unique factor require different solutions. A review of the historical client performance and particular circumstances will likely provide these answers.
Strategic reasons may compel a firm to keep an underperforming client. For example, if there is not a ready replacement for Practice 2’s Client 1, a decision must be made about when to put the relationship at risk. Consider that Client 1 is generating $60,347 in profit, paying $39,000 ($19,833*2) of Partner 3’s salary, and absorbing $65,584 of the firm’s overhead, much of which will remain after sacking the client. A marketing plan to replace this underperforming client might be a better long run decision.
By now, the value of regularly evaluating these data should be apparent. Our only caution is to take a constructive approach to interpret results and effecting corrective action. Using these data to help attorneys improve profitability and increase income is stronger than a critical or penalty-based approach.
Our next post will focus more on interpreting results by reviewing achievable (target) profit margins. Future posts will include creating a useful historical and trend analysis, and how to use probability data in compensation.
All of your previous posts are included on our blog and will be available in an eBook when the series is complete.
For more information on law firm client profitability or any of these topics or to see our prior posts, please visit our website Performlaw.com and our blog performlaw.com/law-firm-best-practices-blog.
If would like to learn more about getting affordable client profitability reports for your law firm, let's talk.